
Out of those 731,000 sitting in jail, 3 out of 5 are legally presumed innocent, awaiting trail or resolution of their cases

Source: Todd D. Minton and Daniela Golinelli, Jail Inmates at Midyear 2013 - Statistical Tables. (Washington, DC: U.S. Department of Justice, Office of Justice Programs, Bureau of Justice Statistics, 2014), appendix table 3, p. 11
Despite the country growing safer with violent crime down 49 percent and property crime down 44 percent
Since the 1970's annual admissions to jails have grown from 6 million to 11.7 million, a number equivalent to the combined populations of Los Angeles and New York City.
(That is a third of ALL Americans behind bars on a given day)

Source: For jail rates, see Craig A. Perkins, James J. Stephan, and Allen J. Beck, Jails and Jail Inmates: 1993-94. (Washington, DC: U.S. Department of Justice, Office of Justice Programs, Bureau of Justice Statistics, 1995); Allen J. Beck and Jennifer C. Karberg, Prison and Jail Inmates at Midyear 2000. (Washington, DC: U.S. Department of Justice, Office of Justice Programs, Bureau of Justice Statistics, 2001); Todd D. Minton and Daniela Golinelli, Jail Inmates at Midyear 2013 - Statistical Tables. (Washington, DC: U.S. Department of Justice, Office of Justice Programs, Bureau of Justice Statistics, 2014); and for crime rates, see Uniform Crime Reporting Statistics - UCR Data Online at http://www.ucrdatatool.gov/.
In 1978, 19% of U.S. adult residents, 24% of prisoners, and 25% of jail inmates were military veterans.
By 2011,12, veterans accounted for 9% of the general population, 8% of state and federal prisoners, and 7% of jail inmates.
About half of all veterans in prison (48%) and jail (55%) had been told by a mental health professional they had a mental disorder.
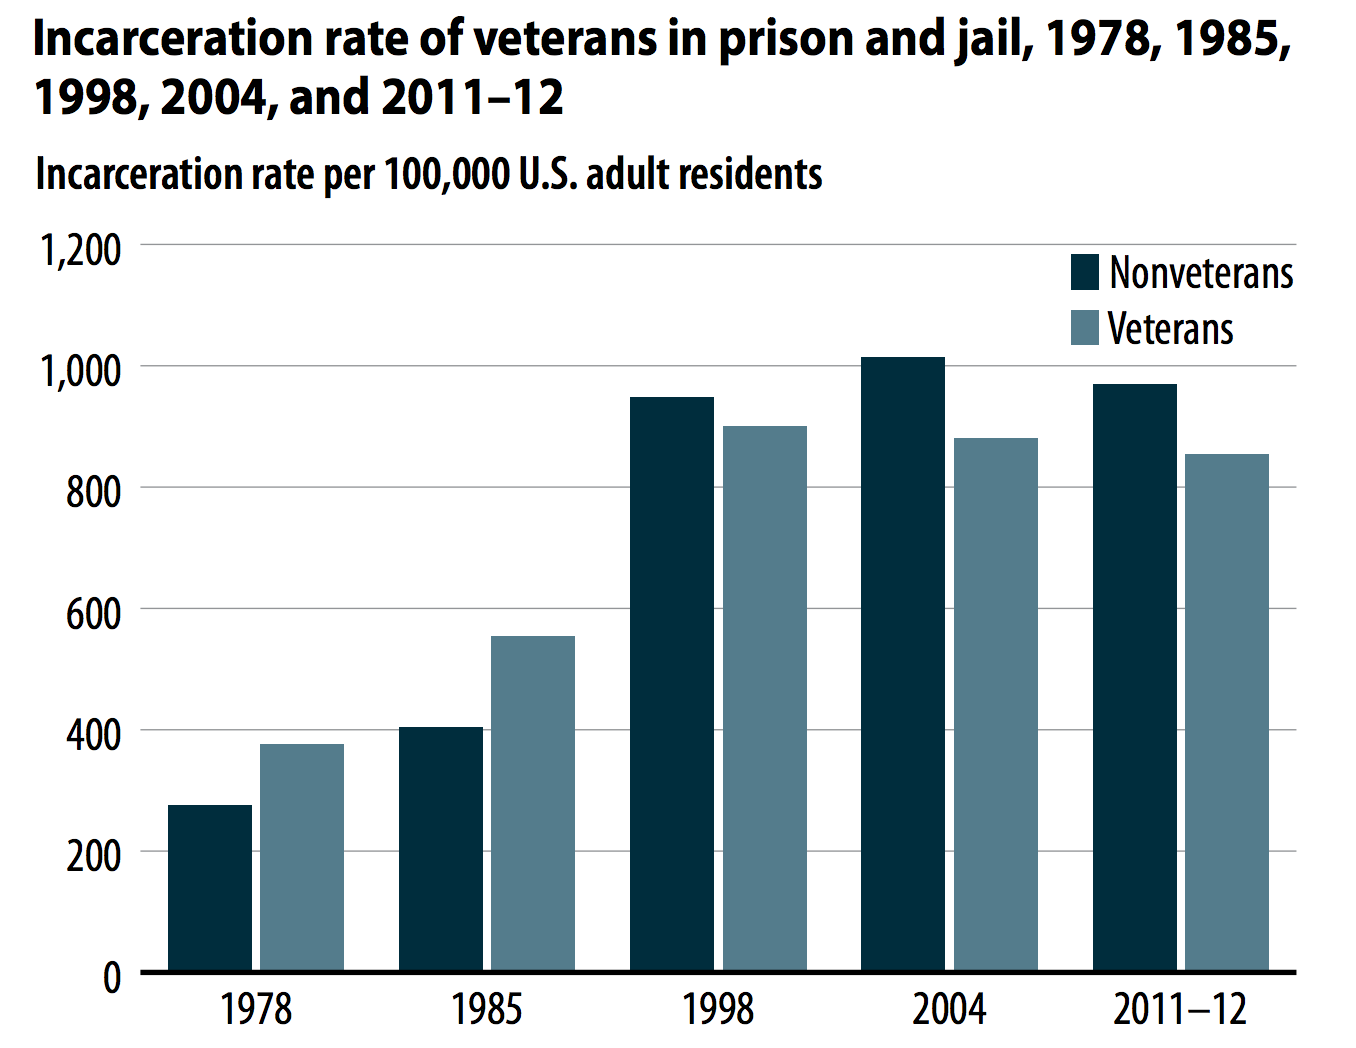
Note: Incarceration rates are based on the U.S. resident population of persons age 18 or older. Rates for nonveterans are based on the number of nonveterans in the U.S. adult resident population. Rates for veterans are based on the number of veterans in the U.S. adult resident population. Source: Bureau of Justice Statistics data collections on prison and jail inmates and U.S. Census Bureau population data collections. See table 1 for complete list.
Source: Bureau of Justice Statistics data collections on prison and jail inmates and U.S. Census Bureau population data collections. See table 1 for complete list.
The United States has less than 5% of the World's population but nearly 25% of the World's Prisoners.
Costing the United States over $80 Billion in taxes.
Though debtors prisons were formerly abolished in the United States almost two hundred years ago, many people today are returned to jail for non-payment of fines and fees
Among formerly incarcerated men hourly wages decreased by 11 percent, annual employment by nine weeks, and annual earnings by 40 percent as a result of time spent in jail or prison

Source: The Pew Charitable Trusts, Collateral Costs: Incarceration’s Effect on Economic Mobility (Washington, DC: The Pew Charitable Trusts, 2010).
Neurological researchers from the University of Denver find that 96% of high-risk Denver inmates had traumatic brain injury
Inmates were noted to either be punched in the head in fistfights, shot, knocked around as children, beaten by spouses or struck by cards. National statistics indicate 67-80% of jail and prison inmates have a traumatic brain injury. For the general population, the rate is 6-8.5%
Sources: The State of Colorado Judicial Department